WP2 | Noise correlation function
28 novembre 2019, par
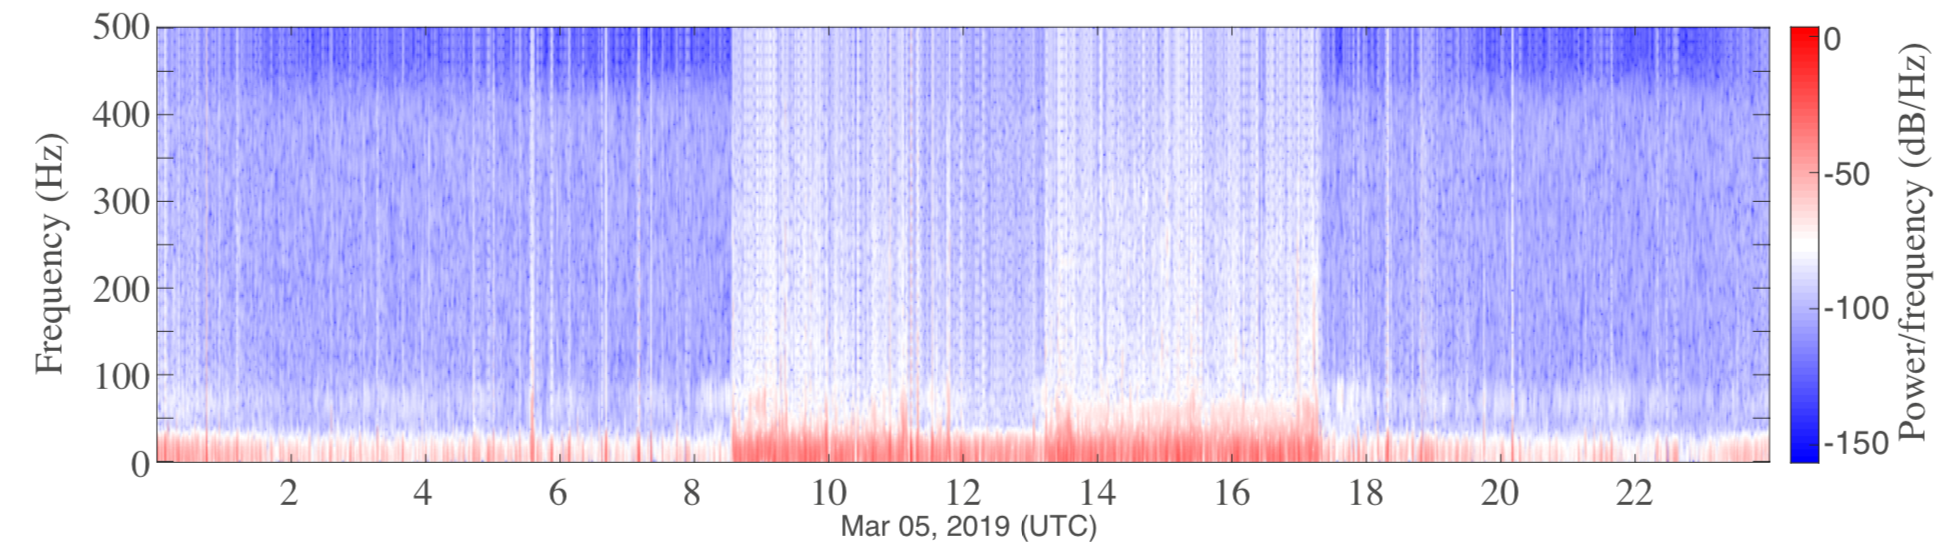
The figure below shows the spectrogram of one full day of recording on 5 March 2019, from station 125-525 at the centre of the main array. The spectrogram contains thousands of impulsive and broadband events triggered by ice cracking, most likely due to the mechanical stress induced by tidal effects. There is also a more consistent trend at lower frequencies between 1 and 25 Hz, where signal exhibits stronger energy levels. The origin of this seismic noise is a mix between wind and water current, under the ice, in the canal. Note the presence of more energetic signals between 8:30 AM and 5:30 PM. They were generated by research field work that took place about 300m North-East of the main array that lasted 12 days from 4 March 16 March 2019.
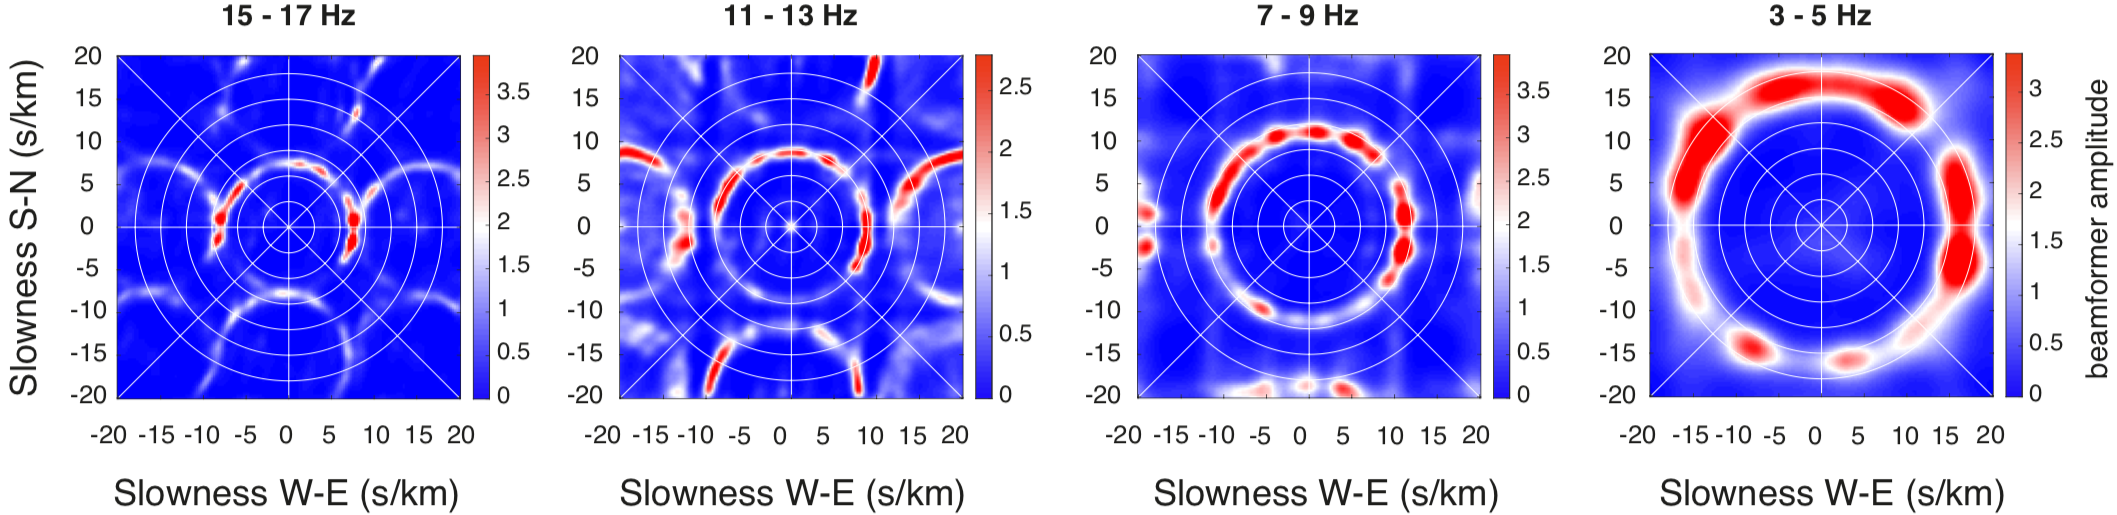
In order to identify the azimuthal distribution of the wavefield around the array, beamforming was applied to 12 hours of noise recording without nearby human activity, on 3 March 2019. This is shown in the figure below. It indicates that noise sources are distributed in all directions around the array. The beamforming amplitude is slightly lower to the South of the array. This is likely the consequence of the array position relative to the edges of the lake, which are closer to the North, East and West than they are to the South. Hence, waves emitted from the Southern part of the lake may have a lower amplitude due to more energy leakage in water. The isotropy of the seismic noise is ideal for the convergence of the noise correlation function (NCF).
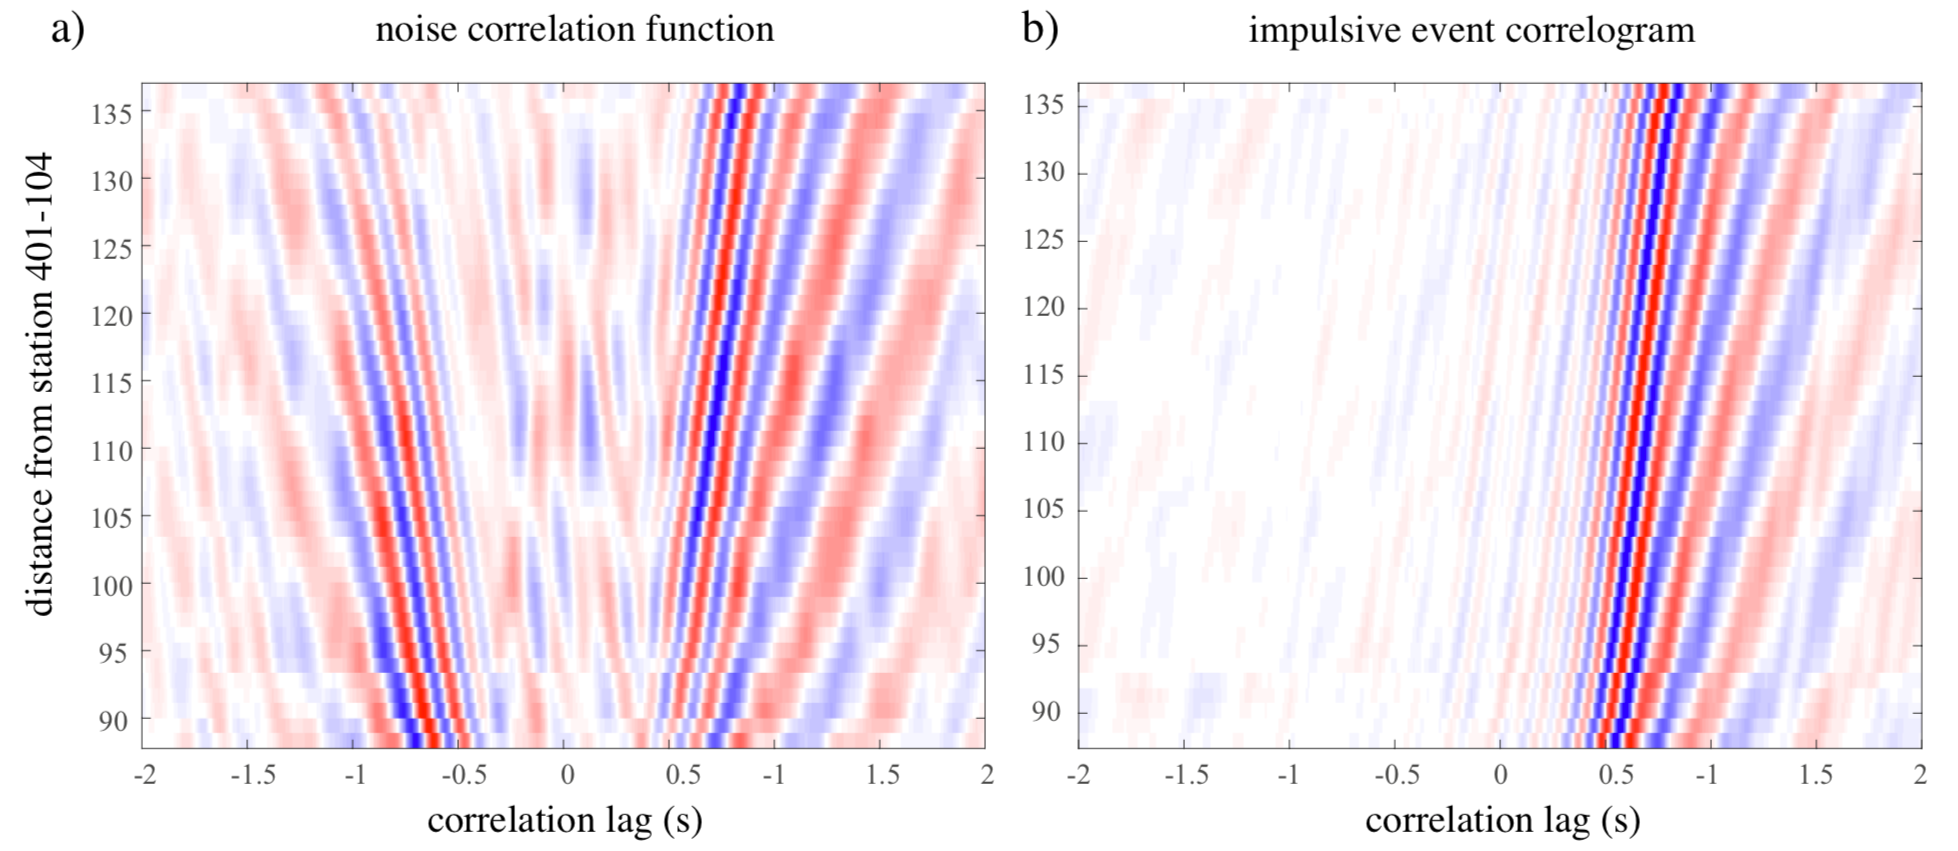
For example, The figure below shows a comparison of the NCF (Figure a) with the Green’s function (Figure -b) between station 401-104 and the stations of line 125 in the main array. The NCF was calculated with 12h of recordings from the vertical displacement field on 3 March 2019. Recordings were first truncated in 30 minutes time windows and spectral whitening was applied in the [1-10] Hz frequency band. The Green’s function was estimated by correlating signals recorded on the vertical channel in the 5 seconds following the impulsive source near station 401-104, and filtered in the same frequency band. The NCF is symmetrical, a typical feature that is expected when the source distribution is isotropic. The causal part of the NCF converges towards the Green’s function between station 401-104 and those of line 125, and the a-causal part towards the Green’s function propagating in the opposite direction. There is a very good agreement between the causal part of the NCF in Figure-a and the Green’s function approximated from the 5 s event data that is shown in Figure-b. Note the strong dispersion of the waveforms, typical of the quasi-Scholte mode. This was expected because the vertical displacement is dominated by this mode in this frequency band.